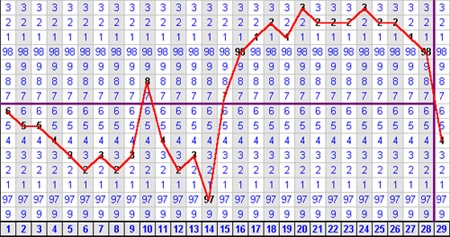
For women looking to increase awareness of their menstrual cycles or fertility, there is no better tool than charting basal body temperature (BBT). A BBT chart can reveal clear patterns of ovulation and menstrual symptoms, or can help to pinpoint problems with fertility and cycle irregularities.
How to Chart BBT
Tools to begin charting Basal Body Temperature:
1. A basal body temperature thermometer (accurate to 0.1 degree fahrenheit).
2. A blank BBT chart.
To find your basal body temperature, you will need to take your temperature first thing upon waking in the morning, before you get out of bed or have anything to drink. When your body is at rest, your body temperature drops slightly below its normal 98.6 degrees. Most women will notice that their basal body temperature is lower by about 1 degree. Taking your temperature at the same time every day will yield the most accurate reading.
Starting on the first day of your cycle (the day you begin bleeding), each day’s basal body temperature should be marked on your blank chart as a small dot. Draw a line connecting each day’s dots to form a curve, which shows the variation in temperature throughout your cycle
Understanding Your BBT Chart
During the follicular phase (first half) of your menstrual cycle, your temperature will be lower than during the luteal phase (second half). Ovulation can be pinpointed as the day before your temperature rise. There may be a slight drop in temperature mid-cycle indicating the day of ovulation, although this is not the case for all women. A shift to higher temperatures occurs following ovulation, indicating the luteal phase of your cycle.
Temperature is the only necessity on a BBT chart, but any sign that you believe may be related to your cycle can be included as well. Many women will include observations of cervical mucus, premenstrual, and menstrual symptoms.
To learn more about BBT charting and what it can tell you about your cycle, I recommend reading Taking Charge of Your Fertility, by Toni Weschler.


